

A popular approach to deal with missing values is to impute the data to get a complete dataset on which any statistical method can be applied. Many imputation methods are available and provide a completed dataset in any cases, whatever the number of individuals and/or variables, the percentage of missing values, the pattern of missing values, the relationships between variables, etc.
However, can we believe in these imputations and in the analyses performed on these imputed datasets?
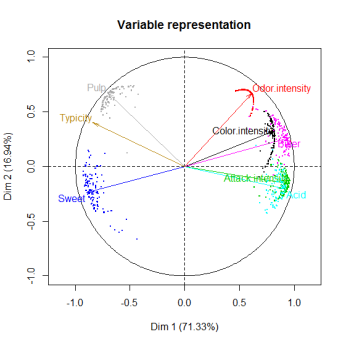
Multiple imputation generates several imputed datasets and the variance between-imputations reflects the uncertainty of the predictions of the missing entries (using an imputation model). In the missMDA package we propose a way to visualize the uncertainty associated to the predictions. The rough idea is to project all the multiple imputed datasets on the PCA graphical representations obtained from the “mean” imputed dataset.
For instance, for the incomplete orange data, the two following graphs read as follows: observation 6 has no uncertainty (there is no missing value for this observation) whereas there is more variability on the position of observation 10. For the variables, the clouds of points represent the uncertainties on the predictions. Ellipses as well as clouds are quite small and encourage to carry-on the analysis on the imputed dataset.

The graphics above where obtained after performing multiple imputation with PCA simply be obtained using the function plot.MIPCA as follows:
library(missMDA)
data(orange)
nbdim <- estim_ncpPCA(orange) # estimate the number of dimensions to impute
res.comp <- MIPCA(orange, ncp = nbdim$ncp, nboot = 1000)
plot(res.comp)
Now we have hints to answer the famous questions: “I have a dataset with xx% of missing values, can I impute it with your method?” or “Is 30% of missing values too much or not?” or “What is the maximum percentage of missing values?” Indeed, the percentage of missing values impacts the quality of the imputation but not only! The structure of the data (i.e. the relationships between variables) is very important. It is indeed possible to have small ellipses with a high percentage of missing values and the other way around. That is why these graphs are useful. The following ones suggest that we must be very careful with subsequent analyses on the imputed dataset, and even it suggests stopping the analysis of this dataset. When there’s nothing good to do, it’s better to do nothing!


This methodology is also available for categorical data with the functions MIMCA and plot.MIMCA to visualize the uncertainty around the prediction of categories.
You can contact us for more information:
julie.josse@polytechnique.edu @JulieJosseStat
husson@agrocampus-ouest.fr

Great post and great package!
Strangely, estim_ncpPCA() runs into an error (length of ‘dimnames’ [2] not equal to array extent) if I have a data set with *NO* missing values. Once i introduce even one NA at random to a cell within the data frame, it runs.
Is there any known reason this might occur?
LikeLike
This is because you should use the function estim_ncp in the FactoMineR package if there is no missing values.
LikeLike
Thank you!
LikeLike
Hi, thanks for this great post and package. Your method to iterate missing values seems convincing since we can get “errors” around individual position and variables, even if I was totally against imputing missing values. I’m wondering if and how we can extract this individual error and use it as weights in a regression ?
LikeLike
You can use the different imputed datasets to perform regression using the Rubin’s rule.
LikeLike
You can use the different imputed datasets to perform regression and have the variance on the estimates of the parameters using the Rubin’s rule.
LikeLike
You can have the error on each value from all the imputed datasets. But the error on the position of the individual cannot be extracted.
LikeLike
Ok, thanks for your reply. What do you think about using the variance of the permuted values for each individual, for instance on the PC1, and use them as weights in a regression between PC1 and an other variable?
LikeLike