“The idea of imputation is both seductive and dangerous” (R.J.A Little & D.B. Rubin).
Indeed, a predicted value is considered as an observed one and the uncertainty of prediction is ignored, conducting to bad inferences with missing values. That is why Multiple Imputation is recommended.
The missMDA package quickly generates several imputed datasets with quantitative variables and/or categorical variables. It is based on dimensionality reduction methods such as PCA for continuous variables or multiple correspondence analysis for categorical variables. Compared to the packages Amelia and mice, it better handles cases where the number of variables is larger than the number of units, and cases where regularization is needed (i.e. when the imputation model is prone to overfitting issues). For categorical variables, it is particularly interesting with many variables and many levels, but also with rare levels.
With 3 lines of code, we generate 1000 imputed datasets for the quantitative orange data available in missMDA:
library(missMDA)
data(orange)
nbdim <- estim_ncpPCA(orange) # estimate the number of dimensions to impute
res.comp <- MIPCA(orange, ncp = nbdim$ncp, nboot = 1000)
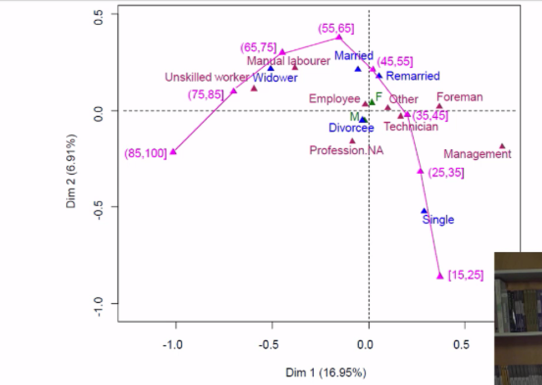
In the same way, MIMCA can be used for categorical data:
library(missMDA)
data(vnf)
nb <- estim_ncpMCA(vnf,ncp.max=5) ## Time-consuming, nb = 4
res <- MIMCA(vnf, ncp=4,nboot=10)
You can find more information in this JSS paper, on this website, on this tutorial given at useR!2016 at stanford.
You can also watch this playlist on Youtube to practice with R.
You can also contact us:
julie.josse@polytechnique.edu @JulieJosseStat
husson@agrocampus-ouest.fr