All you need to know on Multiple Factor Analysis …

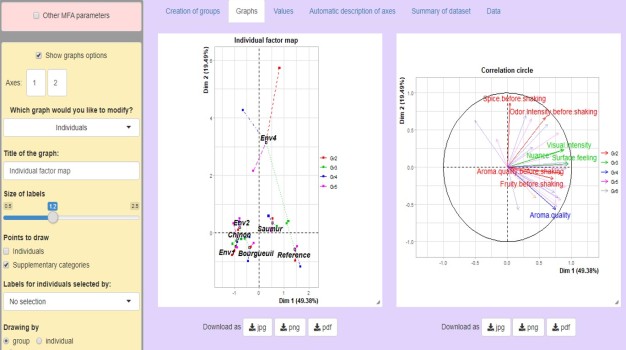
Multiple facrtor analysis deals with dataset where variables are organized in groups. Typically, from data coming from different sources of variables. The method highlights a common structure of all the groups, and the specificity of each group. It allows to compare the results of several PCAs or MCAs in a unique frame of reference. The groups of variables can be continuous, categorical or can be a contingency table.

Implementation with R software

See this video and the audio transcription of this video:

MFA_img

Course videos

Theorectical and practical informations on Multiple Factor Analysis are available in these 4 course videos:

  1. Introduction
  2. Weighting and global PCA
  3. Study of the groups of variables
  4. Complements: qualitative groups, frenquency tables

Here are the slides and the audio transcription of the course.

Materials

Here is the material used in the videos:

All you need to know to analyse a survey with MCA …

All you need to do with MCA to analyse a survey is in Factoshiny!

MCA – Multiple Correspondence Analysis – is a method for exploring and visualizing data obtained from a survey or a questionnaire, i.e. datasets with categorical variables.

The function Factoshiny of the package Factoshiny allows you to perform MCA in a really easy way. You can include extras information such as quantitative variables, manage missing data, draw and improve the graphs interactively, draw confidence ellipses, have several numeric indicators as outputs, perform clustering on the MCA results, and even have an automatic interpretation of the results. Finally, the function returns the lines of code to parameterize the analysis and redo the graphs, which makes the analysis reproducible.

Implementation with R software

See this video and the audio transcription of this video:

ACM_img

The lines of code to do a MCA:

install.packages(Factoshiny)
library(Factoshiny)
data(tea)
result <- Factoshiny(tea)


Course videos

Theorectical and practical informations on Multiple Correspondence Analysis are available in these 4 course videos:

Here are the slides and the audio transcription of the course.

Materials

Here is the material used in the videos:

Management of missing data

This video gives more information on the management of missing data in MCA.

If you want to see more methods on Exploratory Data Analysis, follow this link.

All you need to know on Correspondence Analysis …

Correspondence Analysis – CA – is an exploratory multivariate method for exploring and visualizing contingency tables, i.e. tables on which a chi-squared test can be performed. CA is particularly useful in text mining.

The function Factoshiny of the package Factoshiny allows you to perform CA in an easy way. You can include extras information, manage missing data, draw and improve the graph interactively, have several numeric indicators as outputs, perform clustering on the CA results, and even have an automatic interpretation of the results. Finally, the function returns the lines of code to parameterize the analysis and redo the graphs, which makes the analysis reproducible.

Implementation with R software

See this video and the audio transcription of this video:

CA_img

The lines of code to do a Correspondence Analysis:

install.packages(Factoshiny)
library(Factoshiny)
data(children)
result <- Factoshiny(children)


Course videos

Theorectical and practical informations on Correspondence Analysis are available in these 6 course videos:

  1. Introduction
  2. Visualizing the row and column clouds
  3. Inertia and percentage of inertia
  4. Simultaneous representation
  5. Interpretation aids
  6. Text mining with correspondence analysis

Here are the slides and the audio transcription of the course.

Materials

Here is the material used in the videos:

Follow this link if you want to see more methods on Exploratory Data Analysis.

All you need to know on PCA …

All you need to do with PCA is in Factoshiny!

PCA – Principal Component Analysis – is a well known method for exploring and visualizing data. The function Factoshiny of the package Factoshiny allows you to perform PCA in a really easy way. You can include extras information such as categorical variables, manage missing data, draw and improve the graphs interactively, have several numeric indicators as outputs, perform clustering on the PCA results, and even have an automatic interpretation of the results. Finally, the function returns the lines of code to parameterize the analysis and redo the graphs, which makes the analysis reproducible.

See this video and the audio transcription of this video:

PCAFacto

The lines of code to do a PCA:

install.packages(Factoshiny)
library(Factoshiny)
data(decathlon)
result <- Factoshiny(decathlon)

Theorectical and practical informations on PCA are available in these 3 course videos:

  1. Data – practicalities
  2. Studying individuals and variables
  3. Interpretation aids

Here are the slides and the audio transcription of the course.

Here is the material used in the videos:

And here is a video that gives more information on the management of missing data.

Enjoy to make beautiful visualizations of your data!

If you want to see more methods on Exploratory Data Analysis, follow this link.

Multiple Factor Analysis to analyse several data tables

How to take into account and how to compare information from different information sources? Multiple Factor Analysis is a principal Component Methods that deals with datasets that contain quantitative and/or categorical variables that are structured by groups.

Here is a course with videos that present the method named Multiple Factor Analysis.

Multiple Factor Analysis (MFA) allows you to study complex data tables, where a group of individuals is characterized by variables structured as groups, and possibly coming from different information sources. Our interest in the method is due to it being able to analyze a data table as a whole, but also its ability to compare information provided by the various information sources.

Four videos present a course on MFA, highlighting the way to interpret the data. Then  you will find videos presenting the way to implement MFA in FactoMineR.

With this course, you will be stand-alone to perform and interpret results obtain with MFA.

MFA


Multiple Correspondence Analysis with FactoMineR

How to analyse of categorical data? Here is a course with videos that present Multiple Correspondence Analysis in a French way. The most well-known use of Multiple Correspondence Analysis is: surveys.

Four videos present a course on MCA, highlighting the way to interpret the data. Then  you will find videos presenting the way to implement MCA in FactoMineR, to deal with missing values in MCA thanks to the package missMDA and lastly a video to draw interactive graphs with Factoshiny. And finally you will see that the new package FactoInvestigate allows you to obtain automatically an interpretation of your MCA results.

With this course, you will be stand-alone to perform and interpret results obtain with MCA.

MCA4


For more information, you can see the book blow. Here are some reviews on the book and a link to order the book.

bookR

Correspondence Analysis with FactoMineR

How to analyse a contingency table – count or document-word matrix? Here is a course with videos that present Correspondence Analysis in a French way. Five videos present a course on CA, highlighting the way to interpret the data. Then  you will find videos presenting the way to implement in FactoMineR.

With this course, you will be stand-alone to perform and interpret results obtain with Correspondence Analysis.

CA4


For more information, you can see the book blow. Here are some reviews on the book and a link to order the book.

bookR

PCA course using FactoMineR

Here is a course with videos that present Principal Component Analysis in a French way. Three videos present a course on PCA, highlighting the way to interpret the data. Then  you will find videos presenting the way to implement in FactoMineR, to deal with missing values in PCA thanks to the package missMDA and lastly a video to draw interactive graphs with Factoshiny. And finally you will see that the new package FactoInvestigate allows you to obtain automatically an interpretation of your PCA results.

With this course, you will be stand-alone to perform and interpret results obtain with PCA.

PCA3


For more information, you can see the book blow. Here are some reviews on the book and a link to order the book.

bookR

Text Mining on Wine Description

Here is an example of text mining with correspondence analysis.
Within the context of research into the characteristics of the wines from Chenin vines in the Loire Valley (French wines), a set of 10 dry white wines from Touraine were studied: 5 Touraine Protected Appellation of Origin (AOC) from Sauvignon vines, and 5 Vouvray AOC from Chenin vines.
degustationThese wines were described by 12 professionals. The instructions were: for each wine, give one or more words which, in your opinion, characterises the sensory aspects of the wine. This data was brought together in a table with the wines as rows and the columns as words, where the general term Xij is the number of times that a word j was associated with a wine i (data are available here).

This contingency table has been analysed using Correspondence Analysis (CA) to provide an image summarising the diversity of the wines. Continue reading

Interactive plots in PCA with Factoshiny

A beautiful graph tells more than a lenghtly speach!!

So it is crucial to improve the graphs obtained by Principal Component Analysis or (Multiple) Correspondence Analysis. The package Factoshiny allows us to easily improve these graphs interactively.

The package Factoshiny makes interacting with R and FactoMineR simpler, thus facilitating selection and addition of supplementary information. The main advantage of this package is that you don’t need to know the lines of code, and moreover that you can modify the graphical options and see instantly how the graphs are improved. You can visualize this video to see how to use Factoshiny.

essai_gif

Continue reading