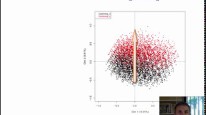
Multiple facrtor analysis deals with dataset where variables are organized in groups. Typically, from data coming from different sources of variables. The method highlights a common structure of all the groups, and the specificity of each group. It allows to compare the results of several PCAs or MCAs in a unique frame of reference. The groups of variables can be continuous, categorical or can be a contingency table.
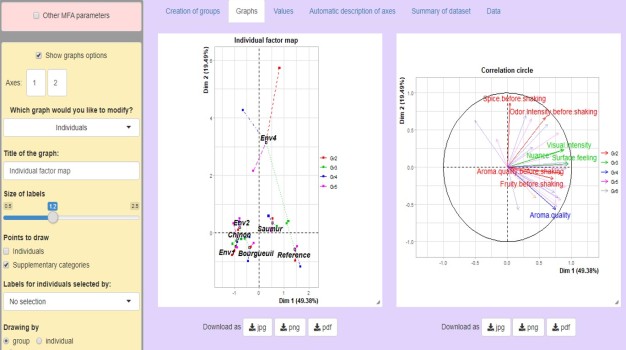
Implementation with R software
See this video and the audio transcription of this video:
Course videos
Theorectical and practical informations on Multiple Factor Analysis are available in these 4 course videos:
- Introduction
- Weighting and global PCA
- Study of the groups of variables
- Complements: qualitative groups, frenquency tables
Here are the slides and the audio transcription of the course.
Materials
Here is the material used in the videos:
- Sensory jurys data: the data set – Rmarkdown– the script with the outputs
- Sensory groups data: Rmarkdown – the script with the outputs