All you need to know on PCA …

All you need to do with PCA is in Factoshiny!

PCA – Principal Component Analysis – is a well known method for exploring and visualizing data. The function Factoshiny of the package Factoshiny allows you to perform PCA in a really easy way. You can include extras information such as categorical variables, manage missing data, draw and improve the graphs interactively, have several numeric indicators as outputs, perform clustering on the PCA results, and even have an automatic interpretation of the results. Finally, the function returns the lines of code to parameterize the analysis and redo the graphs, which makes the analysis reproducible.

See this video and the audio transcription of this video:

PCAFacto

The lines of code to do a PCA:

install.packages(Factoshiny)
library(Factoshiny)
data(decathlon)
result <- Factoshiny(decathlon)

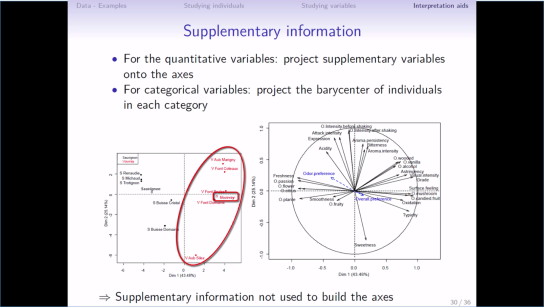
Theorectical and practical informations on PCA are available in these 3 course videos:

  1. Data – practicalities
  2. Studying individuals and variables
  3. Interpretation aids

Here are the slides and the audio transcription of the course.

Here is the material used in the videos:

And here is a video that gives more information on the management of missing data.

Enjoy to make beautiful visualizations of your data!

If you want to see more methods on Exploratory Data Analysis, follow this link.

PCA course using FactoMineR

Here is a course with videos that present Principal Component Analysis in a French way. Three videos present a course on PCA, highlighting the way to interpret the data. Then  you will find videos presenting the way to implement in FactoMineR, to deal with missing values in PCA thanks to the package missMDA and lastly a video to draw interactive graphs with Factoshiny. And finally you will see that the new package FactoInvestigate allows you to obtain automatically an interpretation of your PCA results.

With this course, you will be stand-alone to perform and interpret results obtain with PCA.

PCA3


For more information, you can see the book blow. Here are some reviews on the book and a link to order the book.

bookR

Interactive plots in PCA with Factoshiny

A beautiful graph tells more than a lenghtly speach!!

So it is crucial to improve the graphs obtained by Principal Component Analysis or (Multiple) Correspondence Analysis. The package Factoshiny allows us to easily improve these graphs interactively.

The package Factoshiny makes interacting with R and FactoMineR simpler, thus facilitating selection and addition of supplementary information. The main advantage of this package is that you don’t need to know the lines of code, and moreover that you can modify the graphical options and see instantly how the graphs are improved. You can visualize this video to see how to use Factoshiny.

essai_gif

Continue reading